Software

Every method I develop is released as open-source software with documentation, continuous integration and archived releases. Stable releases carry a Zenodo DOI; the DOIs below are concept DOIs, which always resolve to the latest version.

Single-cell methods

Lead developer

Mellon

Cell-state density estimation. Mellon infers how densely cells populate each state as a Gaussian process over cell-state space, from the distances between neighboring cells, and scales to millions of cells with uncertainty. The density separates stable from transitional states and locates fate commitment. Mellon is integrated into Palantir, an scverse ecosystem package.

Install: pip install mellon · Paper: Nature Methods, 2024
Lead developer

Kompot

Cluster-free differential expression and abundance. Kompot models expression in each condition as a Gaussian-process function on the shared space of cell states and compares the conditions cell by cell with posterior uncertainty, so that changes graded along a transition or confined to part of a cell type are not averaged away. Its gene-level test accounts for the covariance between nearby states that comes from the function estimation, so a change is neither counted twice where states are similar nor missed where it is small everywhere or reverses between related states. Kompot is an scverse ecosystem package.

Install: pip install kompot · Preprint: bioRxiv, under review at Cell Systems

Co-maintainer

Palantir

Cell-fate probabilities along differentiation trajectories, developed in the Pe'er laboratory; an scverse ecosystem package. I co-maintain it and integrated Mellon into it, so that cell-state densities can be computed within Palantir analyses.

Install: pip install palantir

Lead developer

AnnZarro

A read-only browser viewer for AnnData in zarr or h5ad, built around cell-by-cell kernels and distances and gene-by-gene similarities, explored one cell or gene at a time and linked to the expression layers. Clicking a cell paints its row of any cell-by-cell matrix over an embedding or over the tissue section of a spatial dataset. It reads only the chunks on screen, so its cost follows the view rather than the size of the dataset, locally or from cloud storage, and it never writes data or runs code. MIT license, with desktop apps.

Install: pip install annzarro · Preprint: bioRxiv, 2026

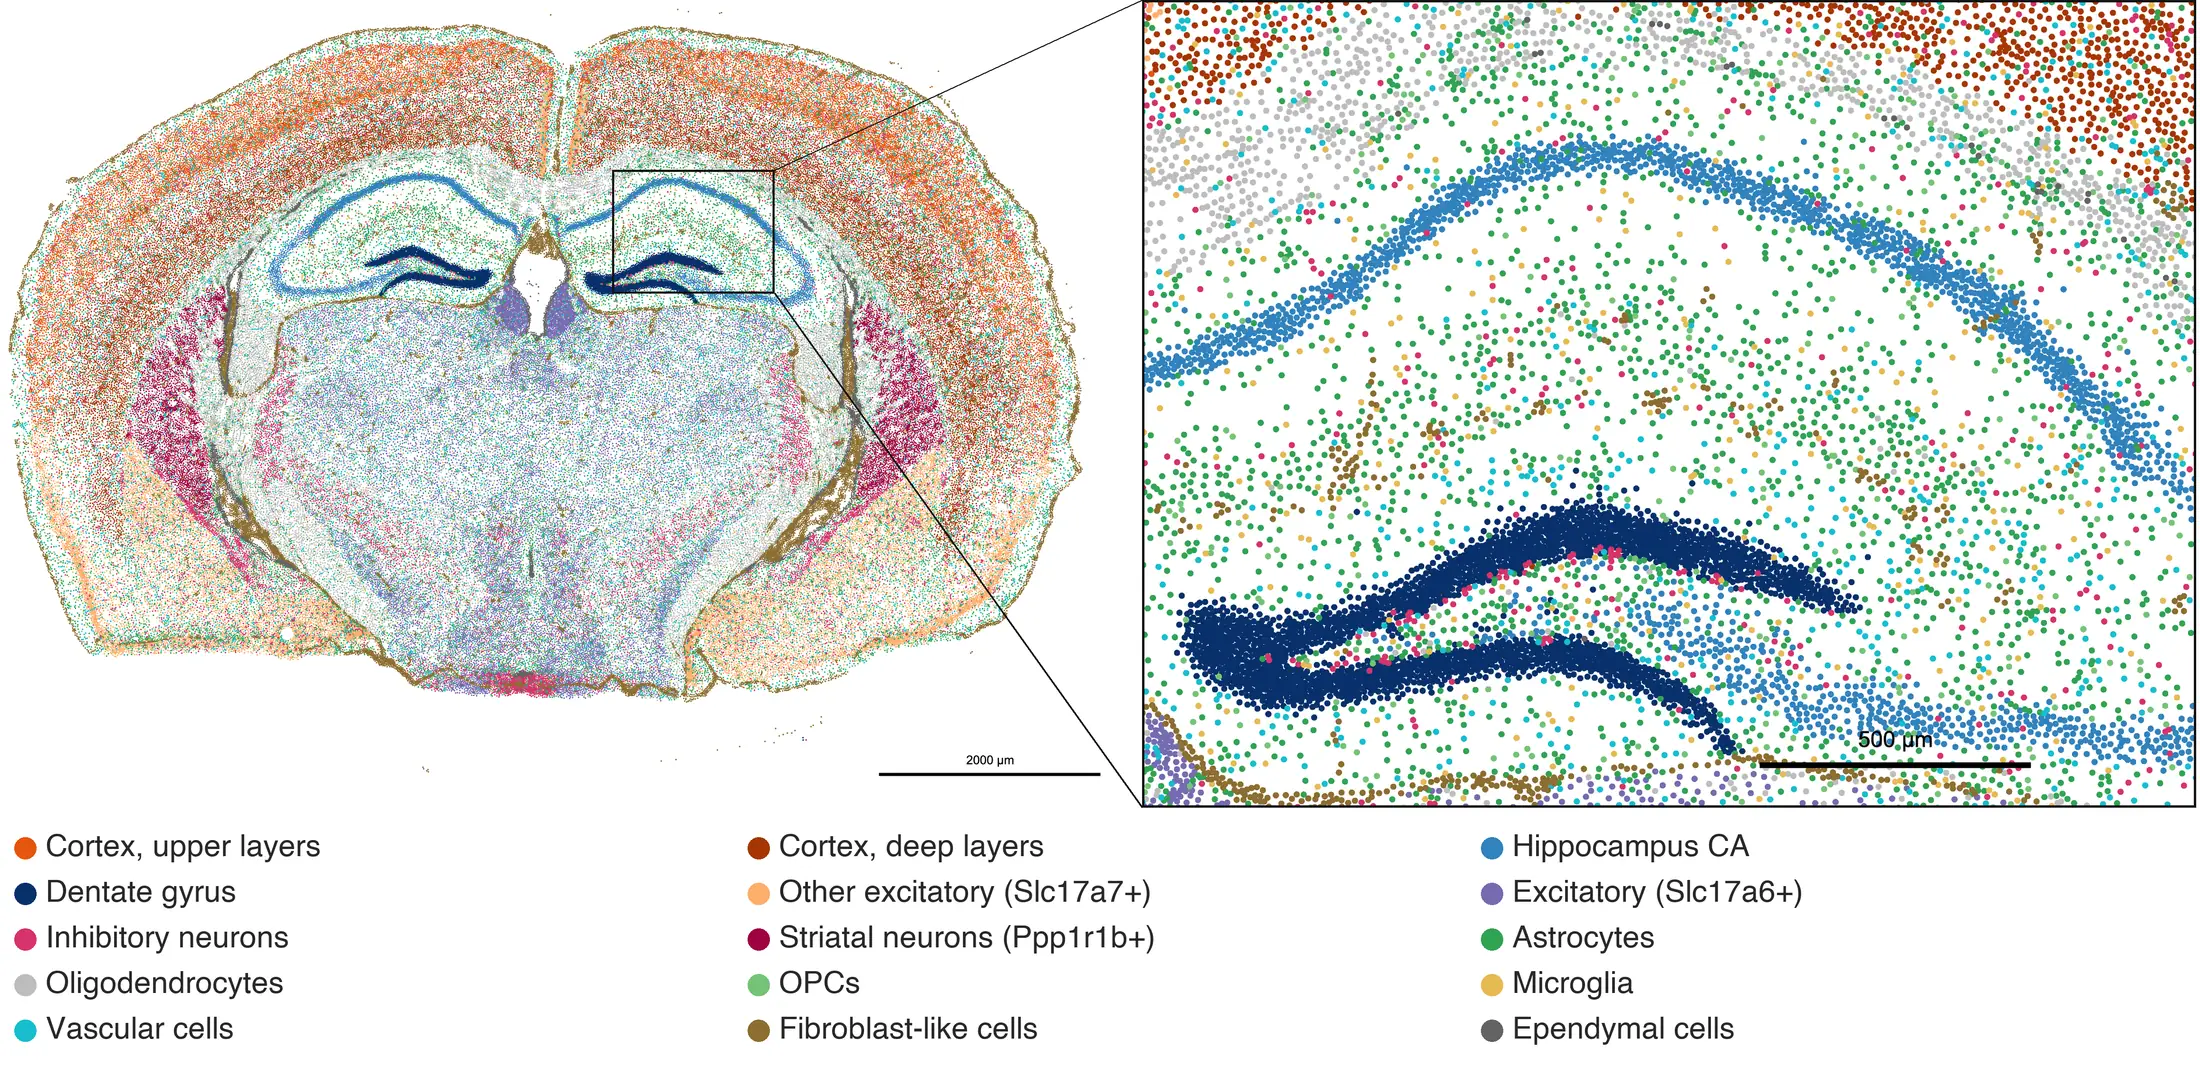
A coronal section of a mouse brain in which every cell is a colored dot: cortical layers in orange and brown, the hippocampus in blue, white matter in grey. A boxed region is enlarged at the right, where single cells of the hippocampus and the deep cortex are visible.
A spatial dataset in AnnZarro: a coronal mouse brain section with all of about 160,000 cells drawn and colored by cell type (assigned from marker genes); the inset shows single cells of the deep cortex, CA1 and dentate gyrus. Public 10x Genomics Xenium data (CC BY 4.0), drawn with AnnZarro 0.7.5.
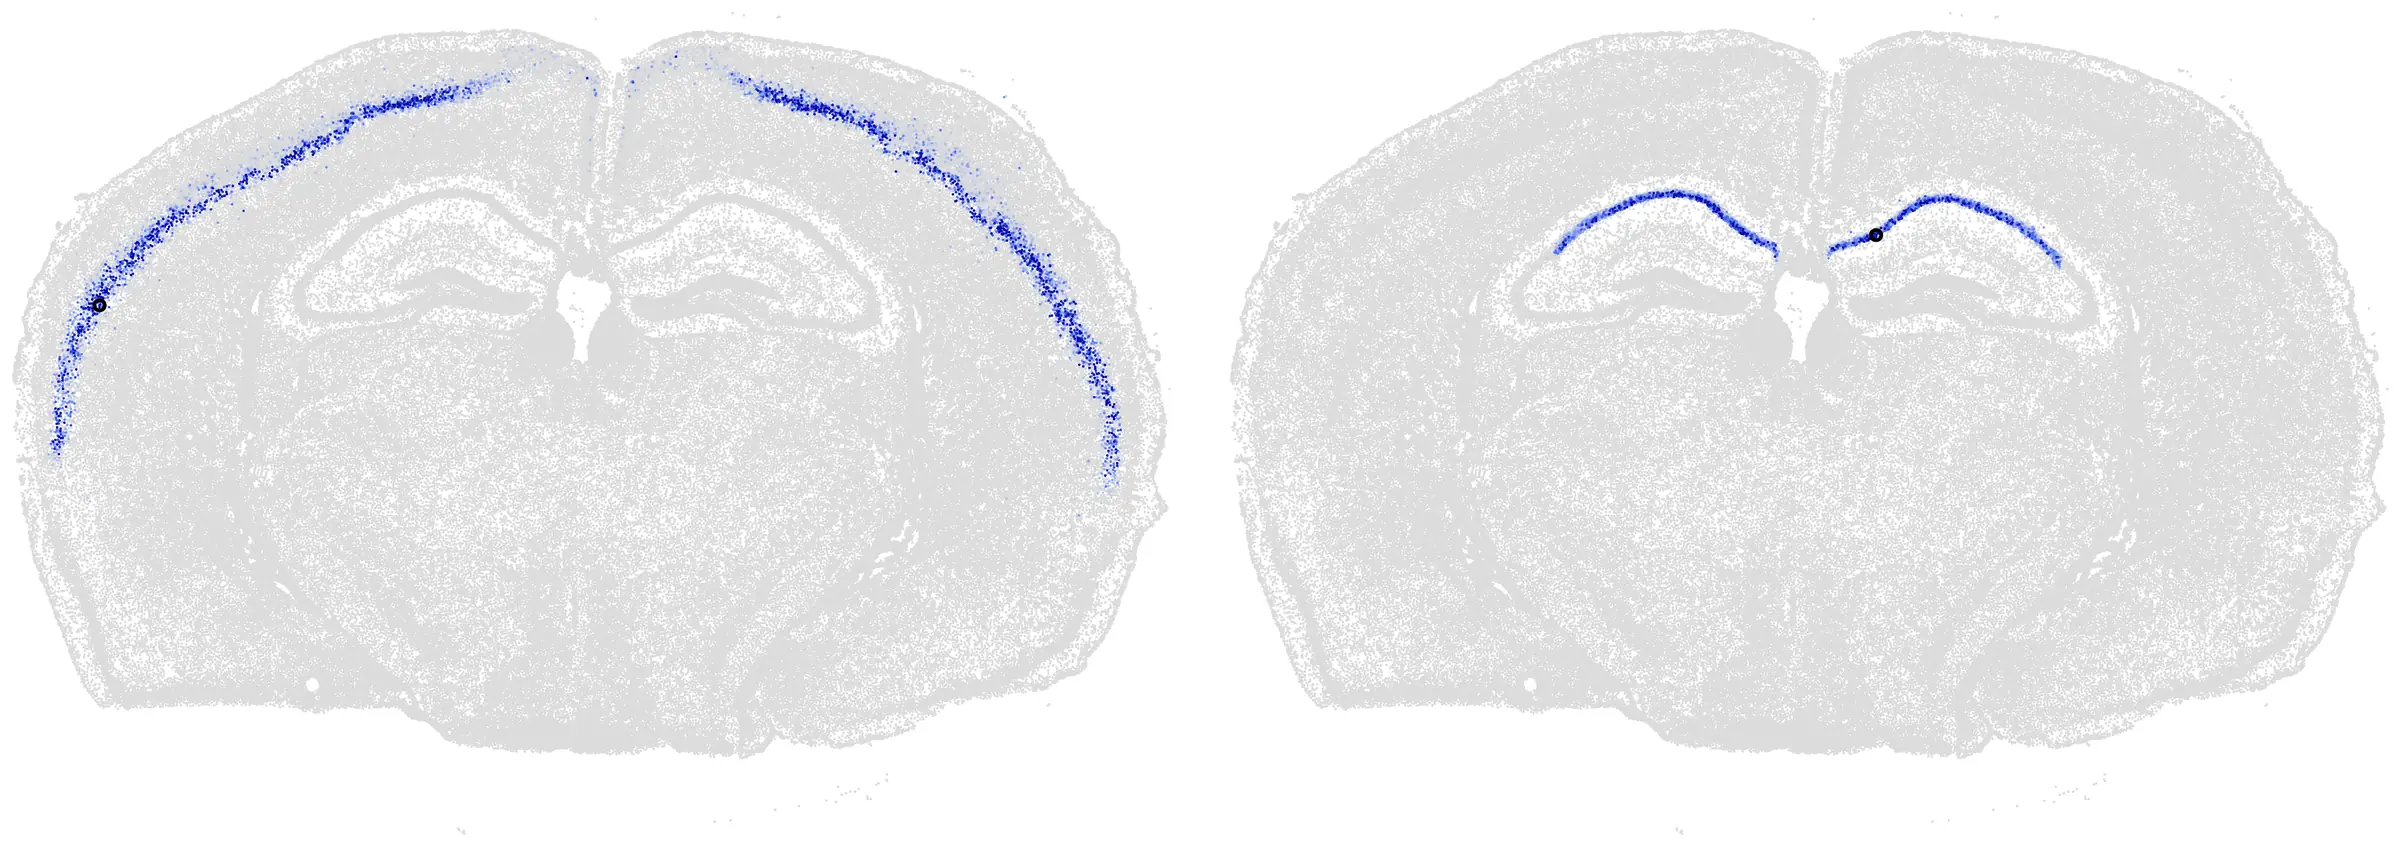
Two copies of a coronal mouse brain section in grey. Left: a band through the middle layers of the cortex in both hemispheres is colored blue. Right: the CA1 band of the hippocampus in both hemispheres is colored blue.
Clicking a cell on the tissue. Each section is colored by a five-step random walk on the gene-expression neighbor graph, started from one cell (black dot): a neuron of the middle cortical layers (left) and a hippocampal CA1 neuron (right). The walk moves only between cells with similar expression, never between tissue neighbors, yet it lands in the cell's own cortical layer (left) or hippocampal field (right), in both hemispheres. Same section and data, exported with AnnZarro 0.7.5.

Exploring one cell at a time

Each step below is one click in AnnZarro: the clicked cell's row of a cell-by-cell distance matrix repaints every cell of the dataset.

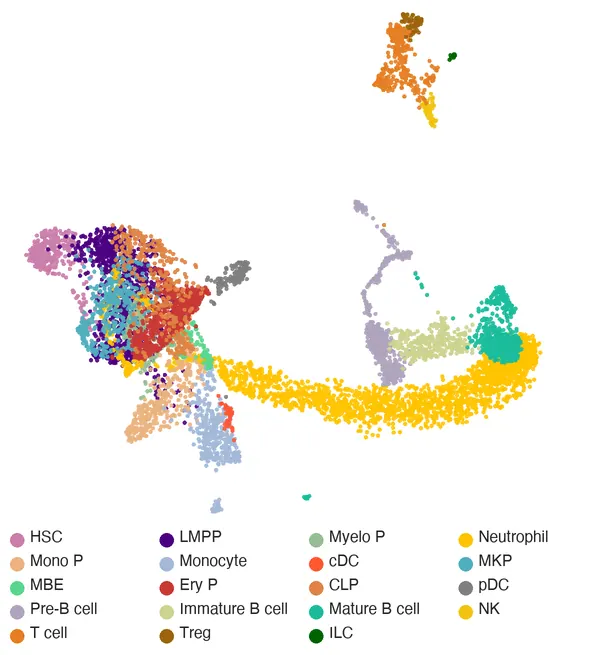
A 3D UMAP of bone marrow cells colored by cell type.
AnnZarro: clicking a cell shows its distances to every other cell. Aging mouse bone marrow (Zenodo, CC BY 4.0).
  1. Cell types

    8,090 bone marrow cells from young, middle-aged and old mice in a 3D UMAP, colored by cell type. Stem and progenitor cells overlap at the left, neutrophils form the long arm, B cells sit at the right, and T and NK cells form the island at the top.

  2. Click a stem cell

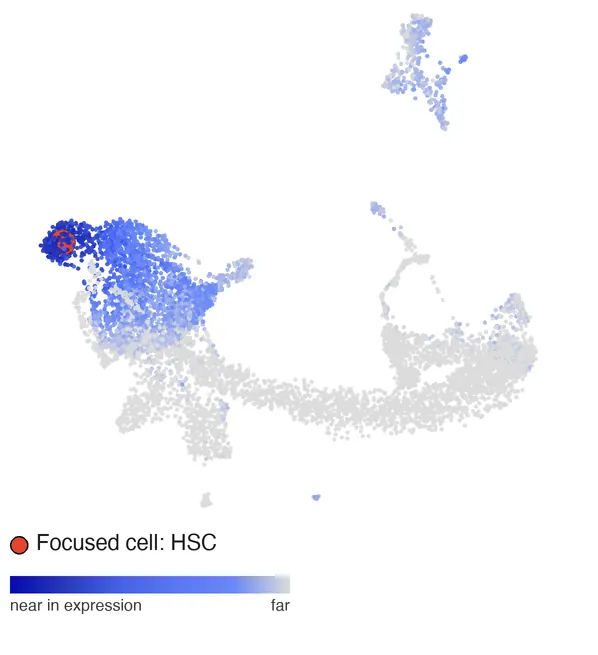
    Clicking a hematopoietic stem cell (red) colors every other cell by how far its expression is from the clicked cell. The nearest cells are other stem cells, and the progenitors beside them are nearer than any mature cell.

    The same 3D UMAP colored by distance to a clicked stem cell: stem cells dark blue, mature cells grey.
  3. A multipotent progenitor

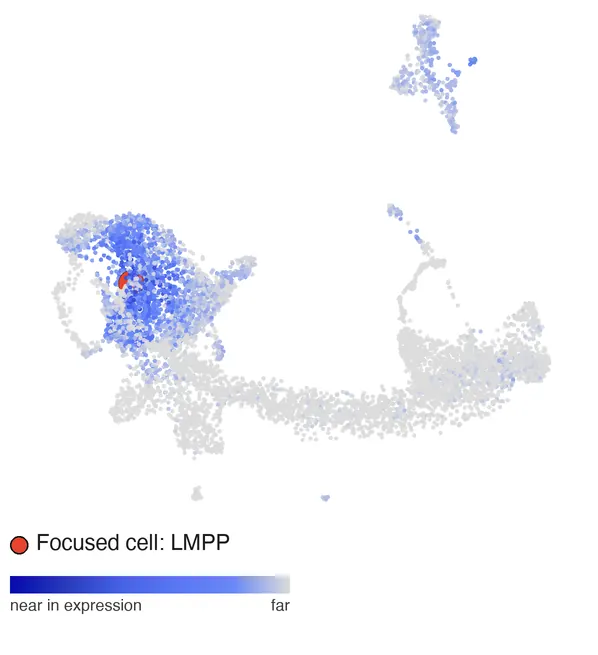
    One click on, a lymphoid-primed multipotent progenitor (LMPP) is near much of the progenitor compartment at once.

    Distance to a clicked LMPP: most progenitors blue.
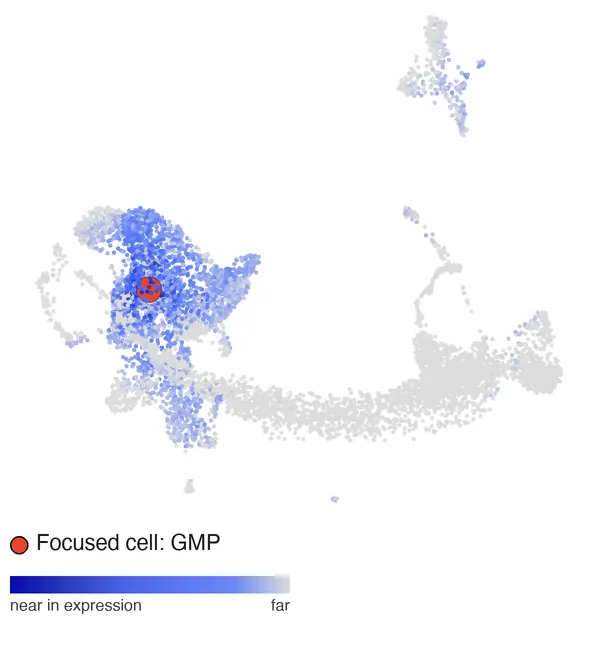
  4. A granulocyte-monocyte progenitor

    For a GMP, the near cells reach down toward the monocyte progenitors.

    Distance to a clicked GMP: blue extends from the progenitors toward the monocyte progenitors.
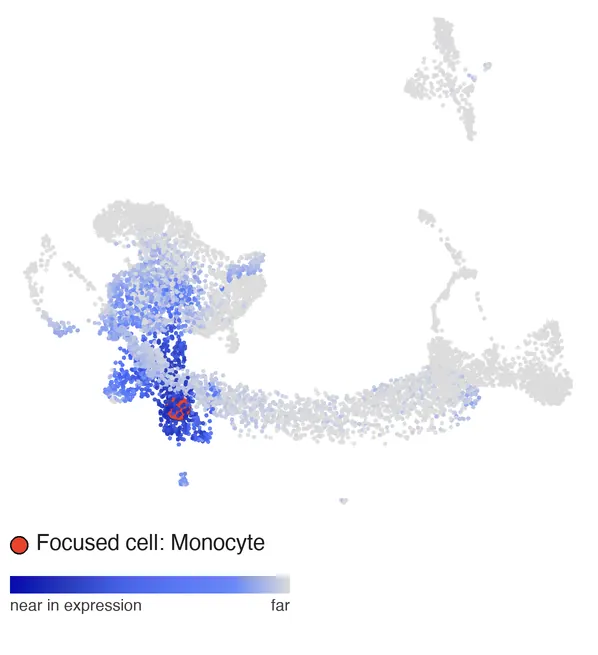
  5. A monocyte

    For a monocyte, the nearest cells are other monocytes and their progenitors; the stem cells are now far.

    Distance to a clicked monocyte: monocytes dark blue, stem cells grey.
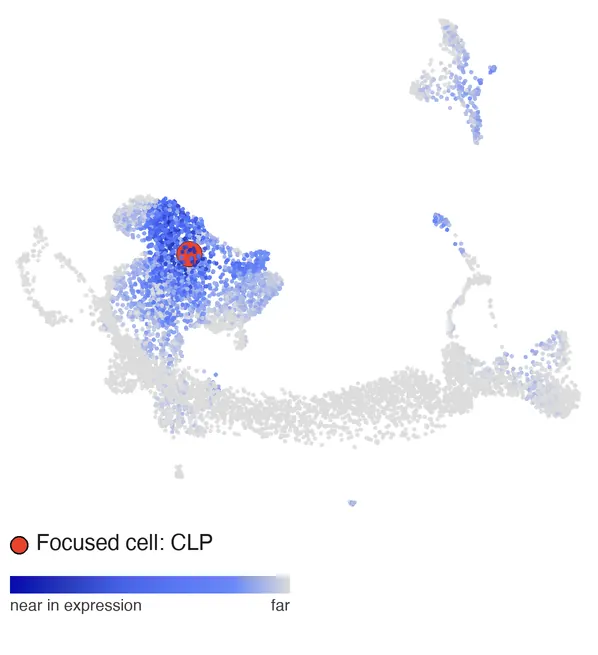
  6. A lymphoid progenitor

    For a common lymphoid progenitor (CLP), the near cells stay among the progenitors, and the T and NK island at the top turns faintly blue while the neutrophils stay grey.

    Distance to a clicked CLP: progenitors blue, the T and NK island faintly blue, neutrophils grey.
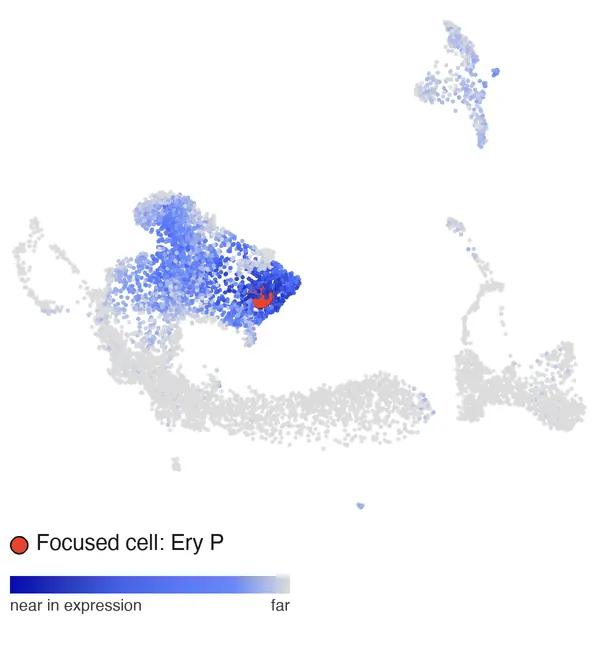
  7. An erythroid progenitor

    For an erythroid progenitor, the nearest cells form the erythroid tip of the progenitor compartment.

    Distance to a clicked erythroid progenitor: the erythroid tip dark blue.

Distance is Euclidean in the first 30 principal components of gene expression, with near cells dark blue; the red dot is the clicked cell. Data: CITE-seq of mouse bone marrow across aging, doi:10.5281/zenodo.15587768 (CC BY 4.0). Frames exported with AnnZarro 0.7.5; the view turns a few degrees per step to show its 3D shape.

Genomics

Lead developer

2for1separator

Deconvolution of active and repressive chromatin signals profiled together by CUT&Tag2for1. Each signal is modeled as a continuous function along the genome, so neighboring positions share information, and inference runs as massively parallel variational inference. Developed with the Henikoff laboratory.

Paper: Genome Biology, 2022 (co-first author)

Infrastructure for AI agents in research

These tools let teams of AI coding agents run analyses on shared computing clusters under the operator's control, with independent re-checks of their results and every result and decision documented. Since April 2026 they have run more than 4,000 agent tasks and 5,000 cluster jobs for my research. How the agents are run and checked.

Developer · MIT license

agent_sandbox

Kernel-enforced sandboxing for AI coding agents on shared HPC clusters. The operator controls which files and credentials agents can reach, and Slurm jobs that agents submit stay sandboxed. Released through Homebrew, with continuous integration and documentation.

Developer · MIT license

Nexus

Orchestration of teams of coding agents from GitHub issues, with independent re-checks of results and every result and decision documented. Public and documented; shipped disabled by design, to be enabled deliberately by each group that adopts it.