Research

What keeps cells in the states a healthy tissue needs, what releases them, and can we learn that regulation well enough to write it?

A cell's expression can change in as many directions as it has genes, yet healthy cells use only a few of them. The states they occupy form a thin sheet through this space of thousands of dimensions, and the directions off that sheet far outnumber those along it. Healthy cells rarely take those directions, because transcription factors, enhancers, chromatin and signals from neighbors pull cells back when they stray. These are the guardrails of cell identity. When one is removed, identity gives way: deleting Pax5 lets committed B cells dedifferentiate and become T cells, and deleting Bcl11b turns committed T cells into cells resembling natural killer cells. Mutations, inflammation and drugs push cells off the sheet, and the guardrails decide whether they return or drift toward disease.

Clusters, trajectories, RNA velocity and virtual-cell models learn from where observed cells are, and so see the few directions cells change along and little of the many in which identity is defended and lost. Noise pushes cells off the sheet as readily as along it, so a sheet that stays thin is itself evidence of regulation pulling them back.

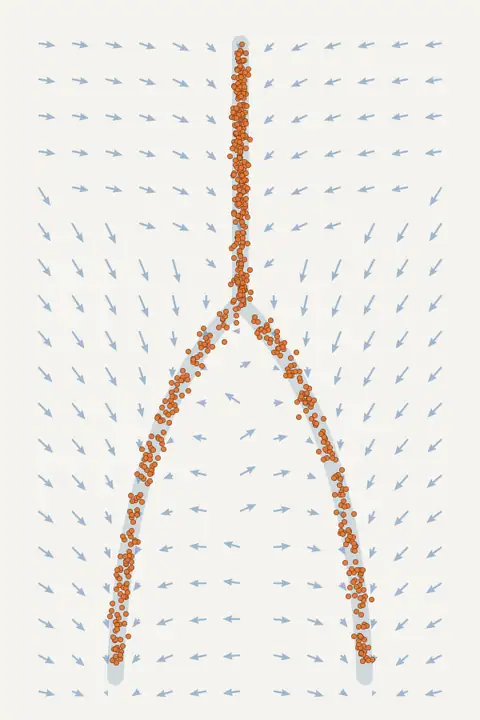
Cells constantly fluctuate, and this noise spreads them in every direction, much as diffusion spreads a drop of ink in water. The states a tissue keeps despite that spread show where regulation holds its cells, while division and loss change how many cells each state holds.

My future laboratory will measure these guardrails: for every cell state, how strongly it is held, which regulators hold it and which perturbations release it. It will then write regulatory DNA that reinforces or releases them. The goal is to identify the small set of regulators that determine how a tissue behaves and how it departs from homeostasis in disease, the candidates for monitoring and intervention. The laboratory will be computational and will work closely with experimental laboratories, which run the measurements the models ask for.

Future directions

The first direction asks which regulation holds each cell state, which perturbations release it, and where that regulation erodes, for example with age or in leukemia. The aim is to learn these guardrails of cell identity from measured distributions of cells, building on Mellon, and to report which parts of the answer the data determine and how certain each is. My NIH K99/R00 award (NIGMS) funds this direction.

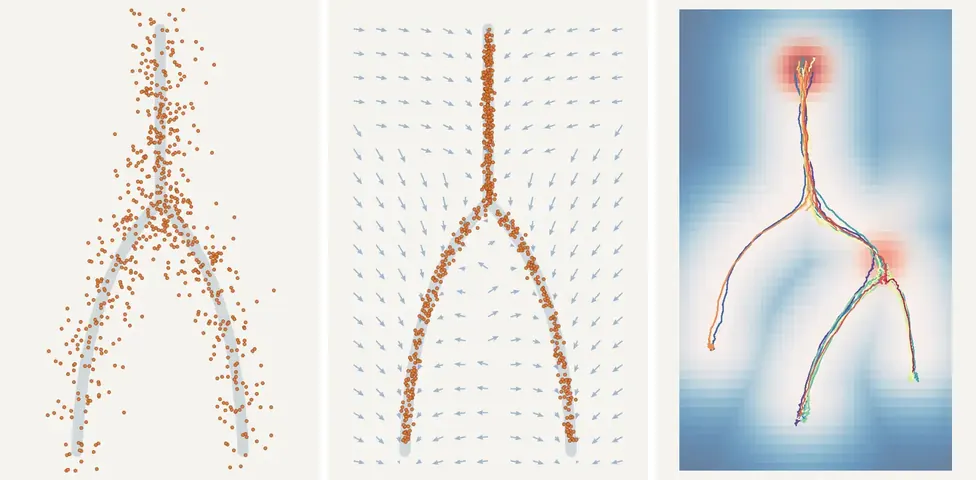
Three panels of synthetic cells on a branching tree of states: cells spread away from the tree, cells held close to it, and cell lineages that divide and are lost along it.
Illustration: fluctuation, regulation and division shape where cells sit. Synthetic cells.

The second asks how a cell's neighbors shape its state. Spatial transcriptomics measures each cell's state and its position, and I am developing ways to describe each cell's surroundings without first assigning cell types, so that spatial organization can be linked to cell state and compared across sections and patients.

The third turns the models around: generative models of regulatory DNA conditioned on the behavior a cell state should show, rather than on a cell-type label, and judged by whether that behavior follows. The laboratory will be computational, and its designs will be tested with partner laboratories.

Foundations: representing a tissue as a whole

My work so far builds layers of one representation of a tissue: the distribution of its cell states, a comparison of conditions on every state, the spatial organization of those states, and, from earlier work, regulation along the genome.

The distribution of cell states

Mellon, which I developed as first author, infers a tissue's distribution of cell states as a smooth, differentiable density from millions of cells, with uncertainty. With it we found that new lineages often emerge through sparsely populated transitions: B-lineage commitment in human hematopoiesis passes a low-density window in which enhancers are primed and EBF1 activates, and the regenerating lung restores its distribution of cell states after injury. Mellon is integrated into Palantir, an scverse ecosystem package.
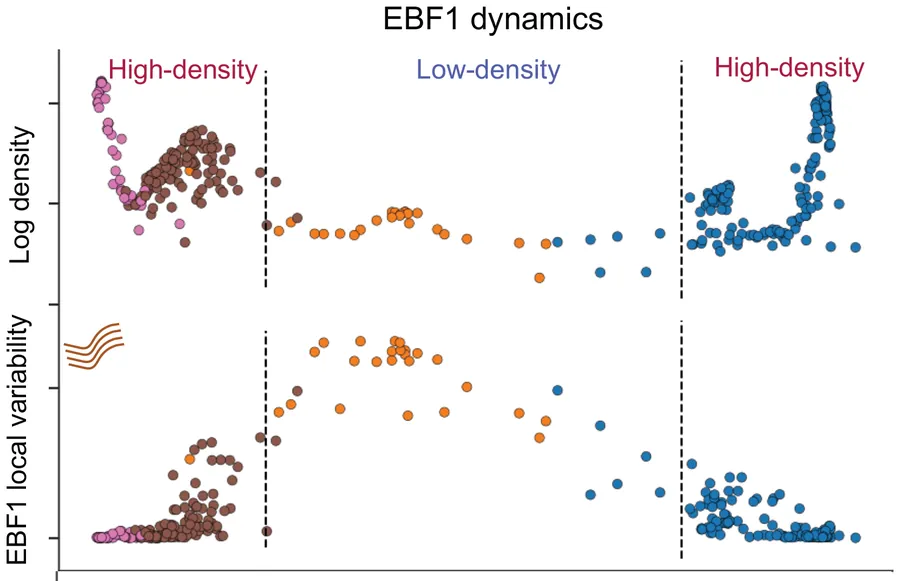
Two panels along the B-cell lineage: log density is high, then low, then high again; EBF1 local variability peaks in the low-density window.
Human B-lineage commitment. Cells ordered along the lineage pass from high to low and back to high density (top); in the low-density window, EBF1 expression varies most between neighboring cells (bottom). Otto et al., Nature Methods 2024.

Where cells accumulate, the density forms valleys when drawn as a landscape: a measured version of Waddington's landscape, in which common states are the valleys that cells settle into.
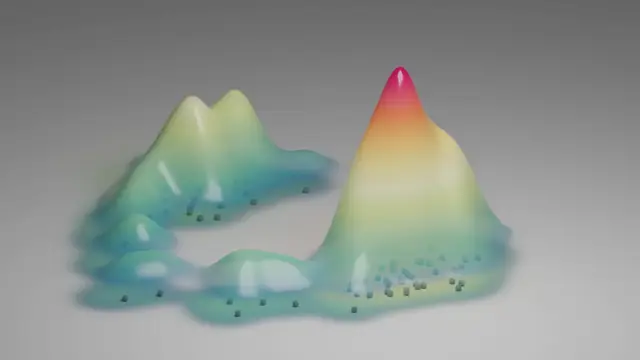
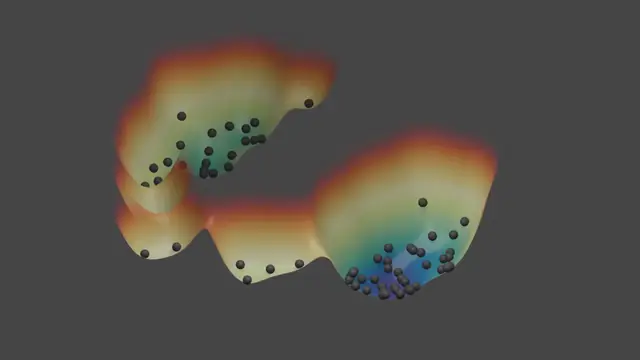
A smooth surface whose height is cell-state density, with cells as dots; the tallest peak is where most cells sit.

Where cells accumulate

The same states drawn as a landscape of valleys and ridges; the cells collect in the deepest valley.

The same states as a landscape

Where cells accumulate, the landscape has valleys: a picture of the states a tissue holds, and of what keeps cells in them. Illustration.

Because Mellon's density can be continuous in time, it shows how a developing tissue's distribution of states shifts between, and not only at, the sampled stages.

Cell-state density as a function of time: mouse gastrulation
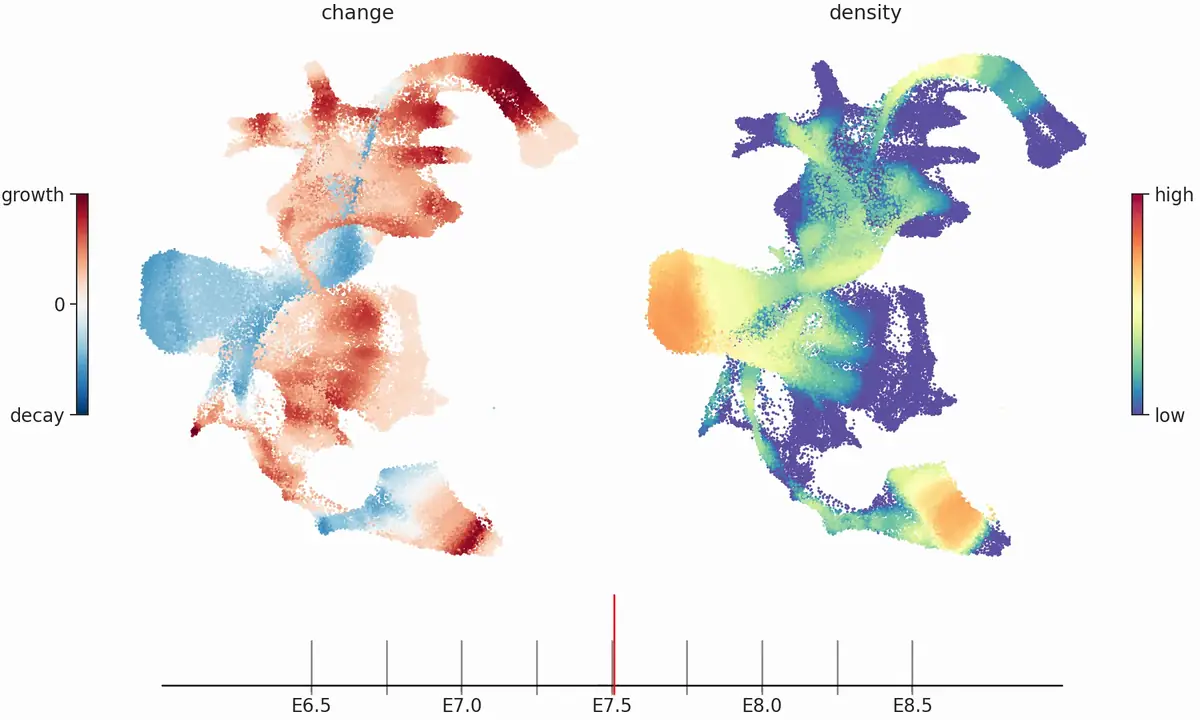
Two maps of all cells from mouse gastrulation at embryonic day 7.5: left, the rate at which the density of each cell state changes over time (growth red, decay blue); right, the cell-state density (low blue, high red); a timeline from E6.5 to E8.5 below.
Mellon's time-continuous cell-state density in mouse gastrulation, E6.5 to E8.5: one density fitted across all nine sampled stages and evaluated at any time in between. Right, the density of each cell state; left, its rate of change (growth red, decay blue), both on a two-dimensional layout of all cells. From Supplementary Video 1 of the Mellon paper; scrolling moves through developmental time. Data: Pijuan-Sala et al., Nature 2019. Analysis: Otto et al., Nature Methods 2024.
  1. E6.5 to E7.5: a growth phase

    The first phase of gastrulation is dominated by growth (red): epiblast and primitive streak cells stay at a nearly constant abundance, in line with their high proliferation.

  2. E7.5: a sharp transition

    Around E7.5 the epiblast and primitive streak states decline rapidly (blue), which marks the completion of gastrulation, while later lineages such as blood keep gaining density.

  3. E8.4: a second transition

    Near E8.4 ectodermal and endodermal structures emerge and their progenitors decline. Because the density is continuous in time, such transitions can be placed between the sampled stages.
Nature Methods, 2024

Comparing conditions without clusters

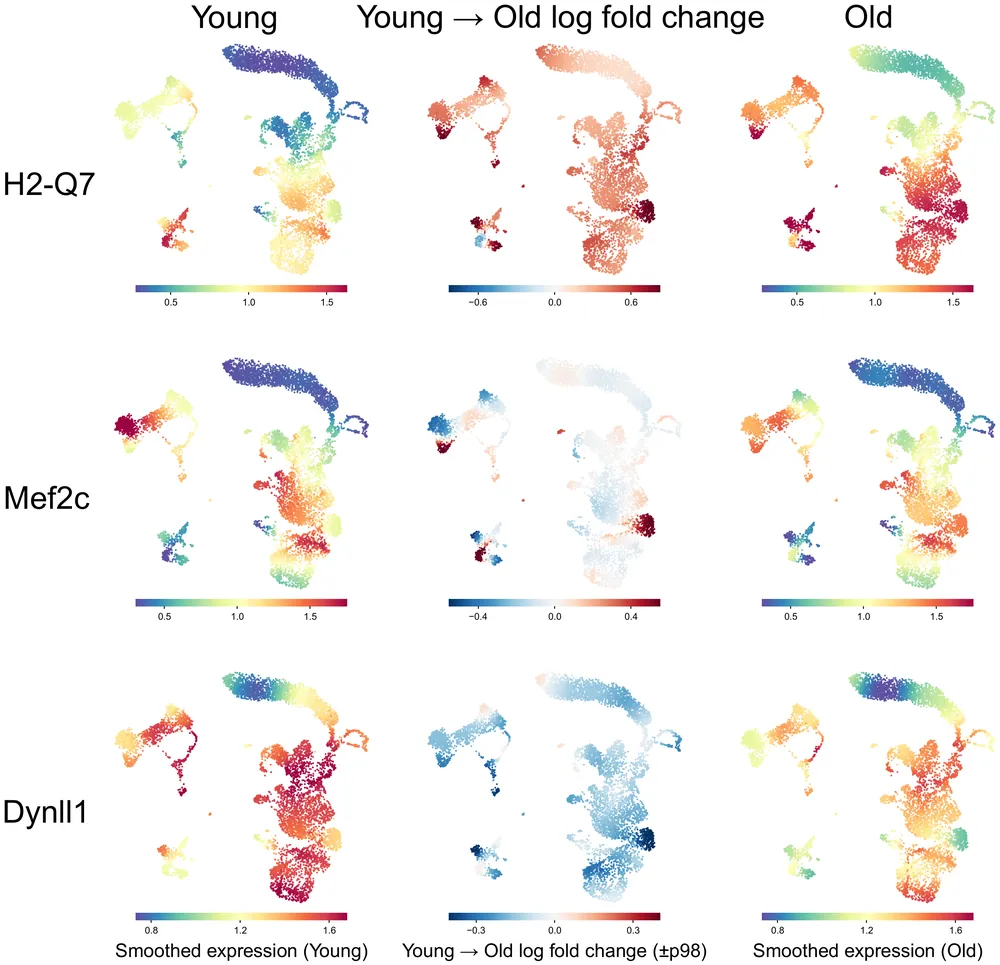
Kompot, which I conceived, performs cluster-free differential expression: it compares conditions cell by cell on the continuum of cell states, for differential expression and abundance, without assigning cells to clusters or neighborhoods, and was the most precise of ten methods in five benchmark scenarios. Because each gene's expression is estimated as a smooth function across cell states, nearby states share information and their estimates are correlated. Kompot accounts for this covariance when it combines a gene's evidence across states, so a change is neither counted twice where states are similar nor missed where it is small everywhere or reverses between related states. In aging mouse bone marrow, age-associated change proved small in aggregate but structured across cell states, some of it confined to part of one cell type.

For the genes H2-Q7, Mef2c and Dynll1, three embeddings of mouse bone marrow cells: smoothed expression in young mice, the young-to-old log fold change per cell, and smoothed expression in old mice.
Aging mouse bone marrow. For three genes: expression in young mice (left), the change with age at every cell (middle) and expression in old mice (right). Mef2c changes only in parts of cell types. Otto et al., bioRxiv (2025), under review at Cell Systems; CC BY 4.0.

bioRxiv, under review at Cell Systems

Regulation along the genome

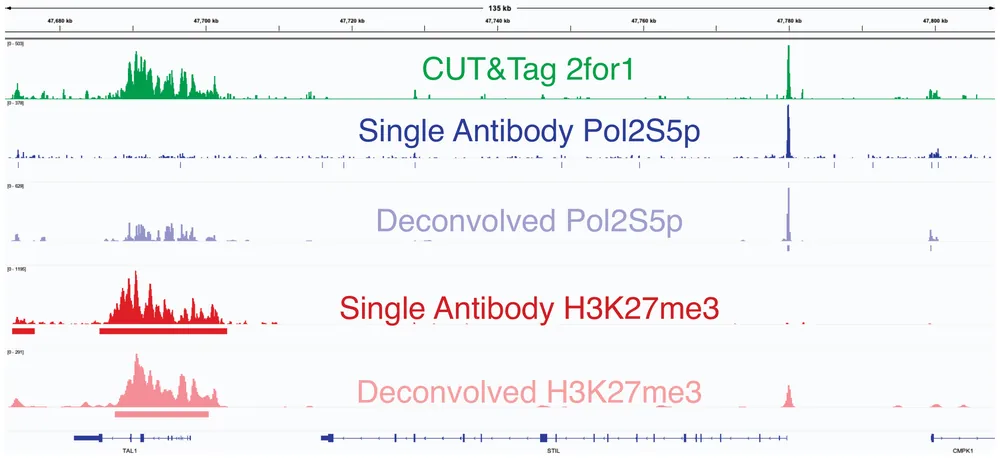
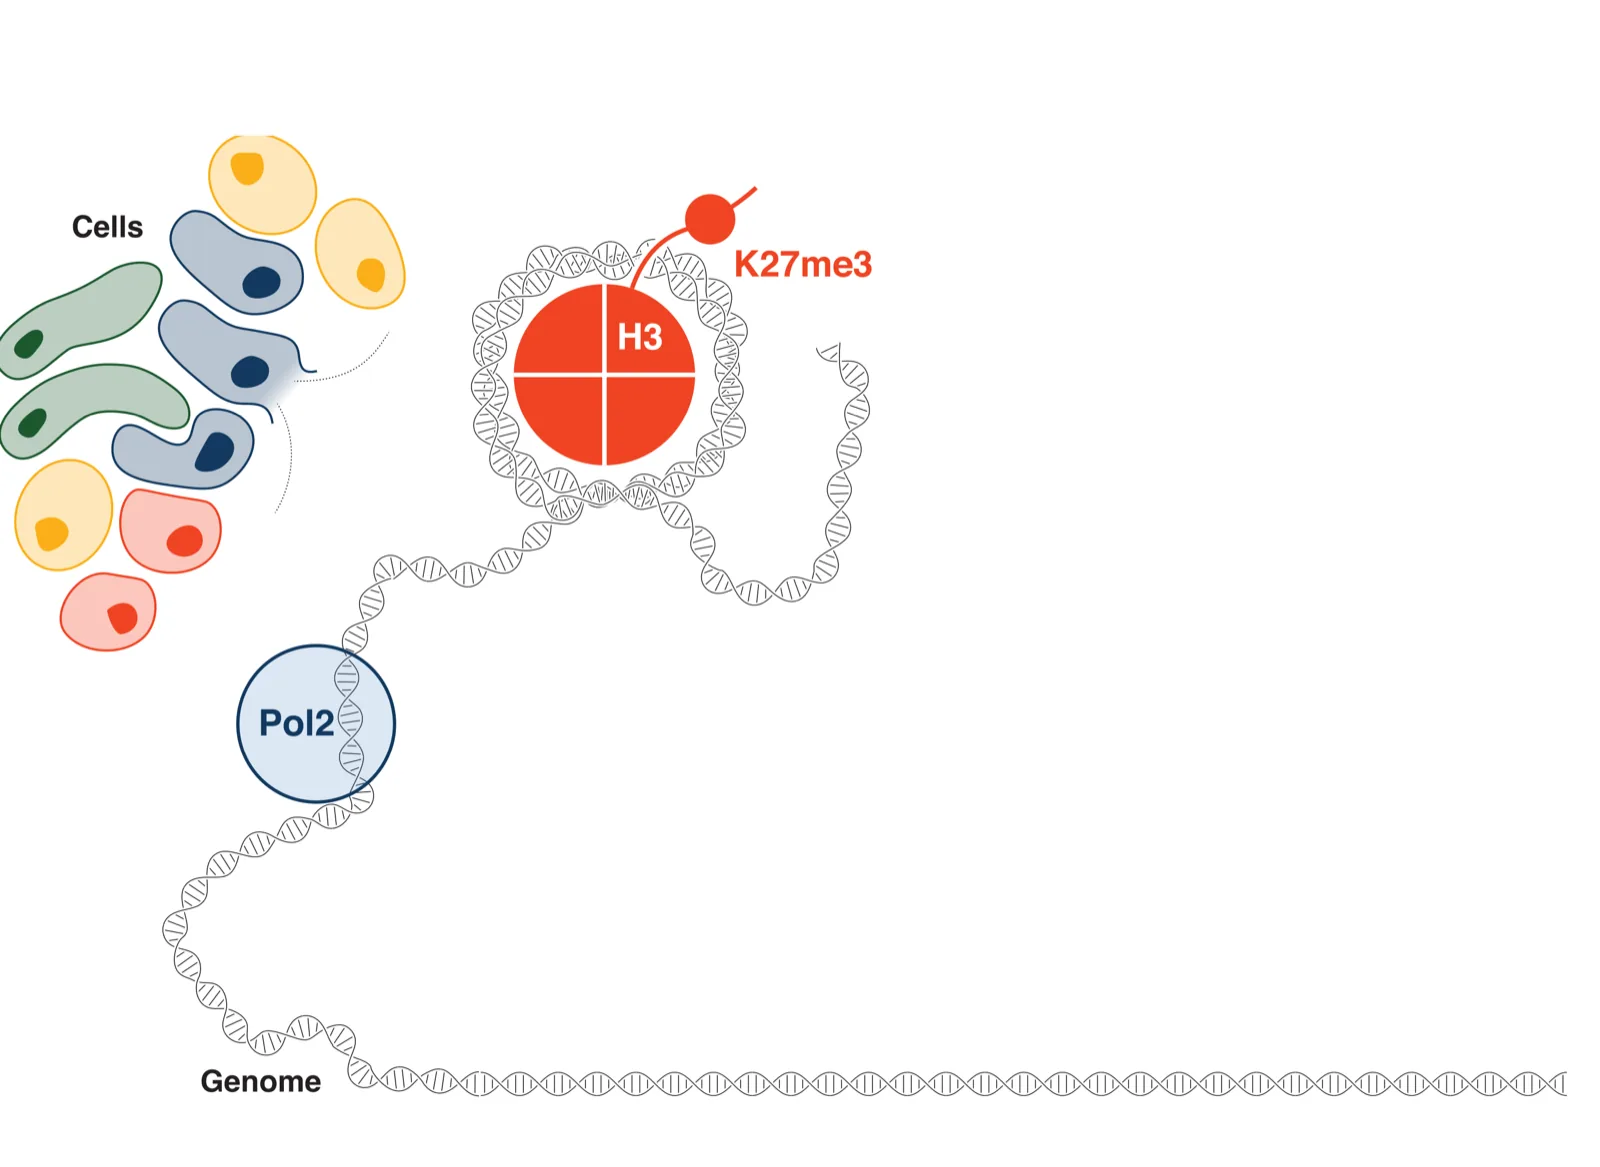
With Steven Henikoff's laboratory I co-designed the statistical inference that separates two chromatin profiles, the accessible and the silenced regulome, from one CUT&Tag2for1 experiment in single cells. 2for1separator treats chromatin as a continuous signal along the genome, the choice I later made for cell states. The separated profiles match those of experiments with a single antibody.

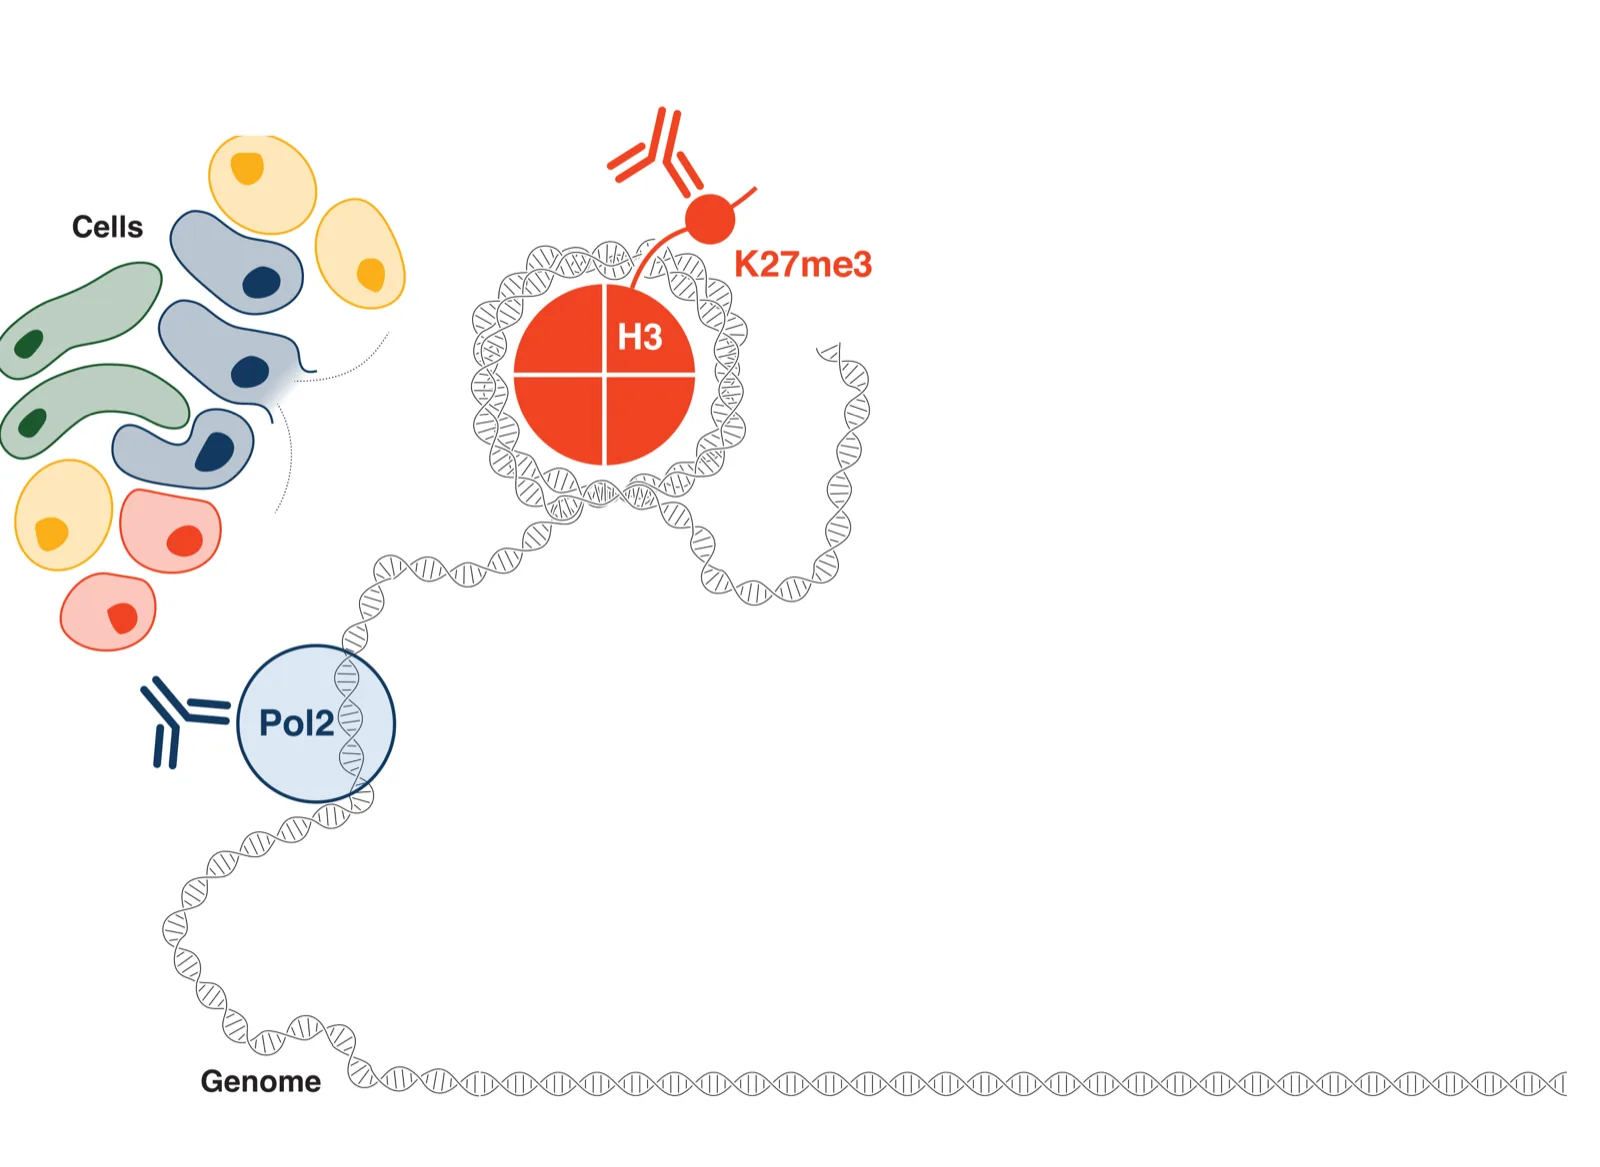
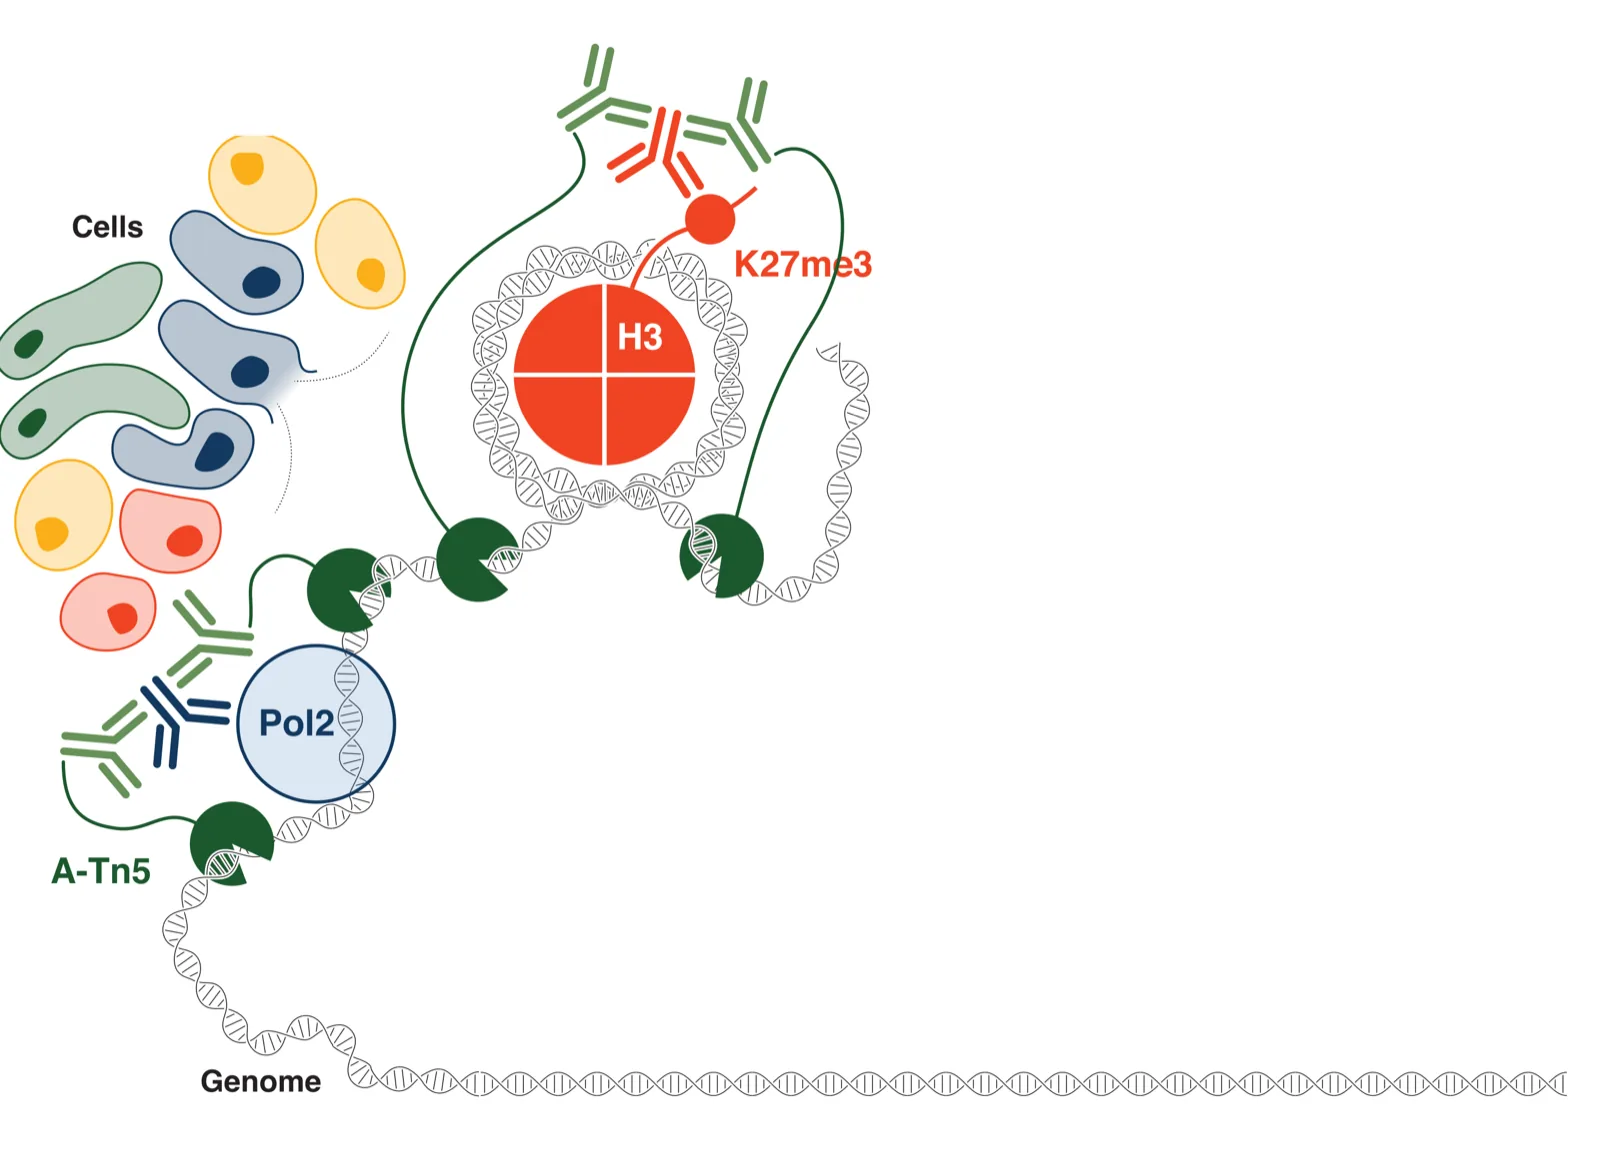
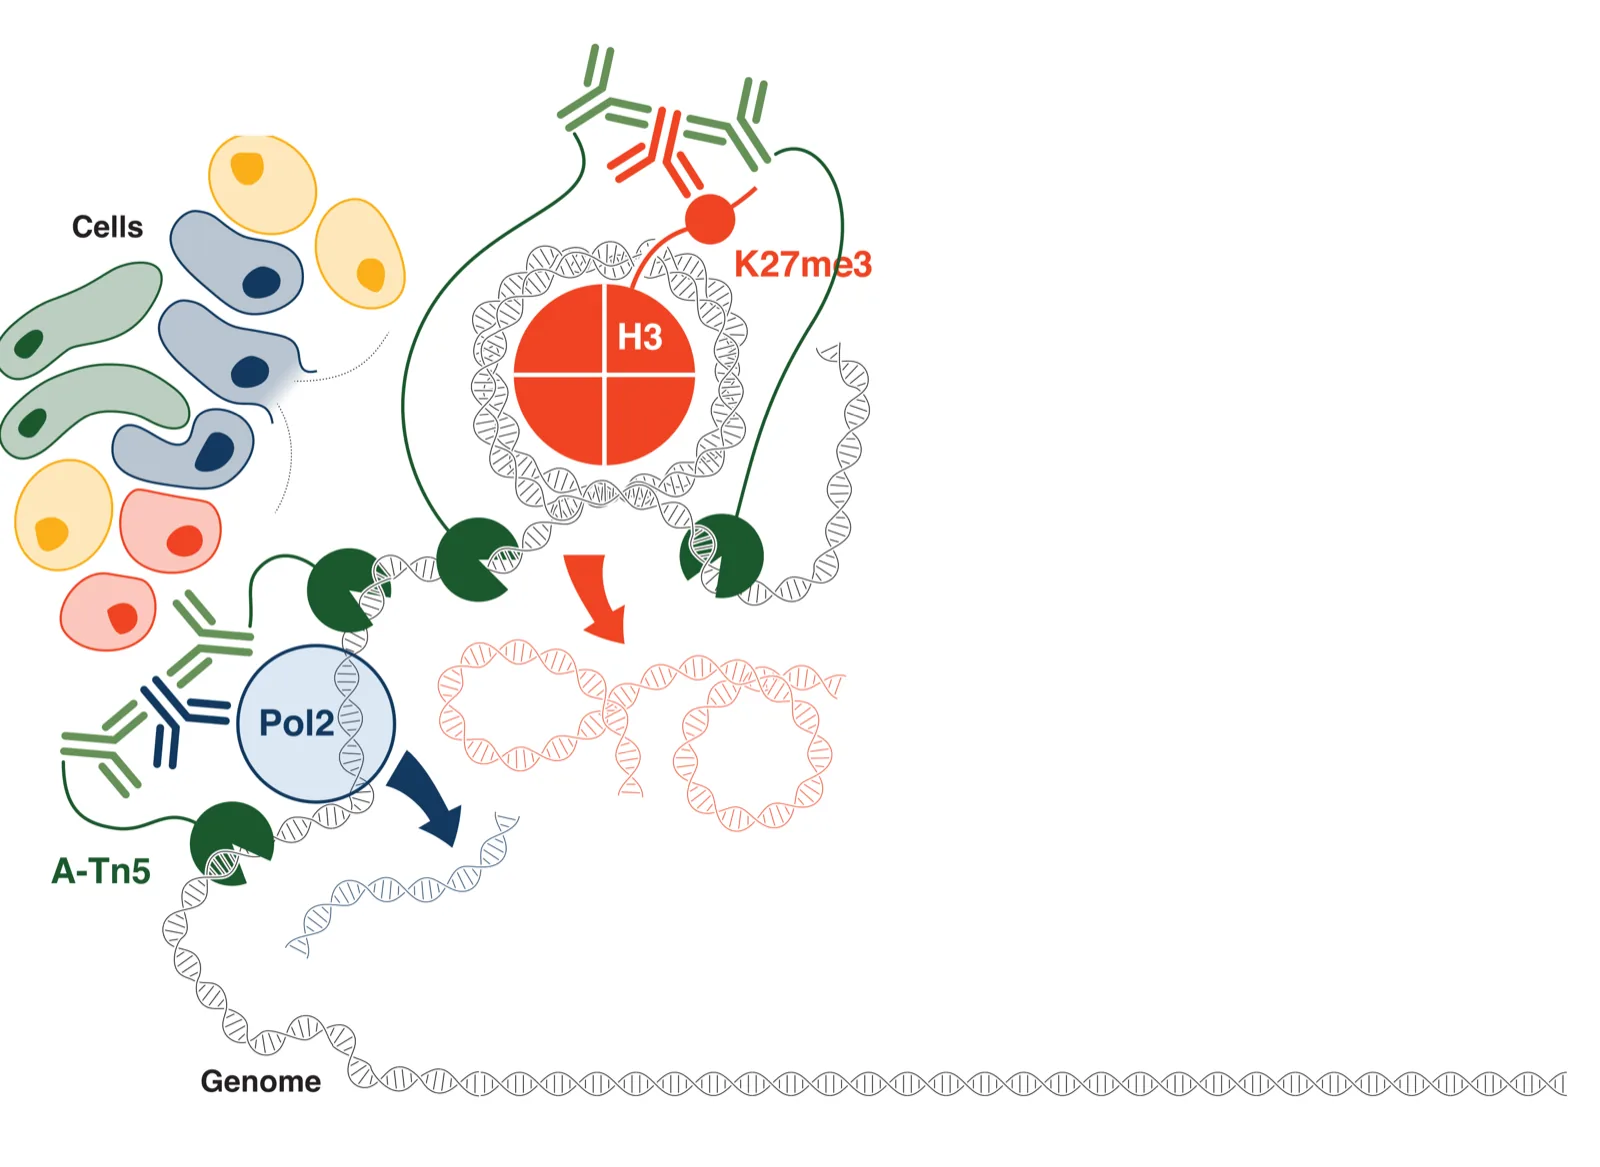
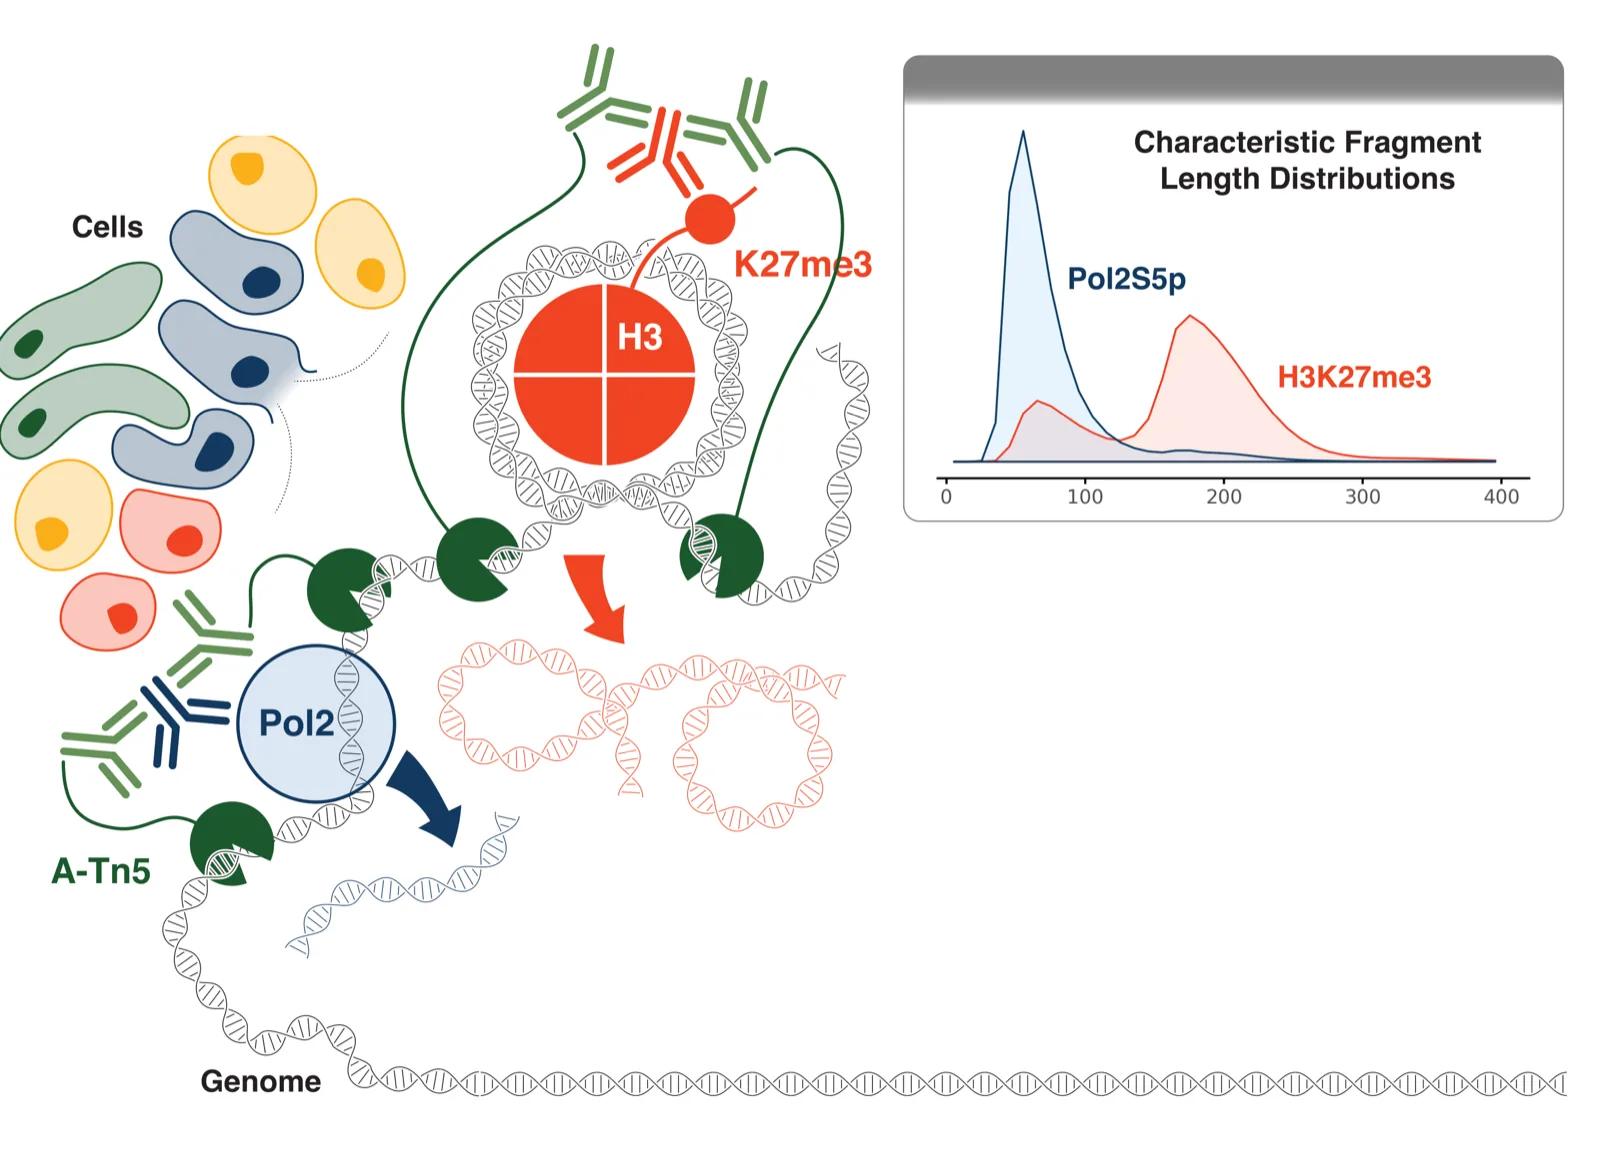
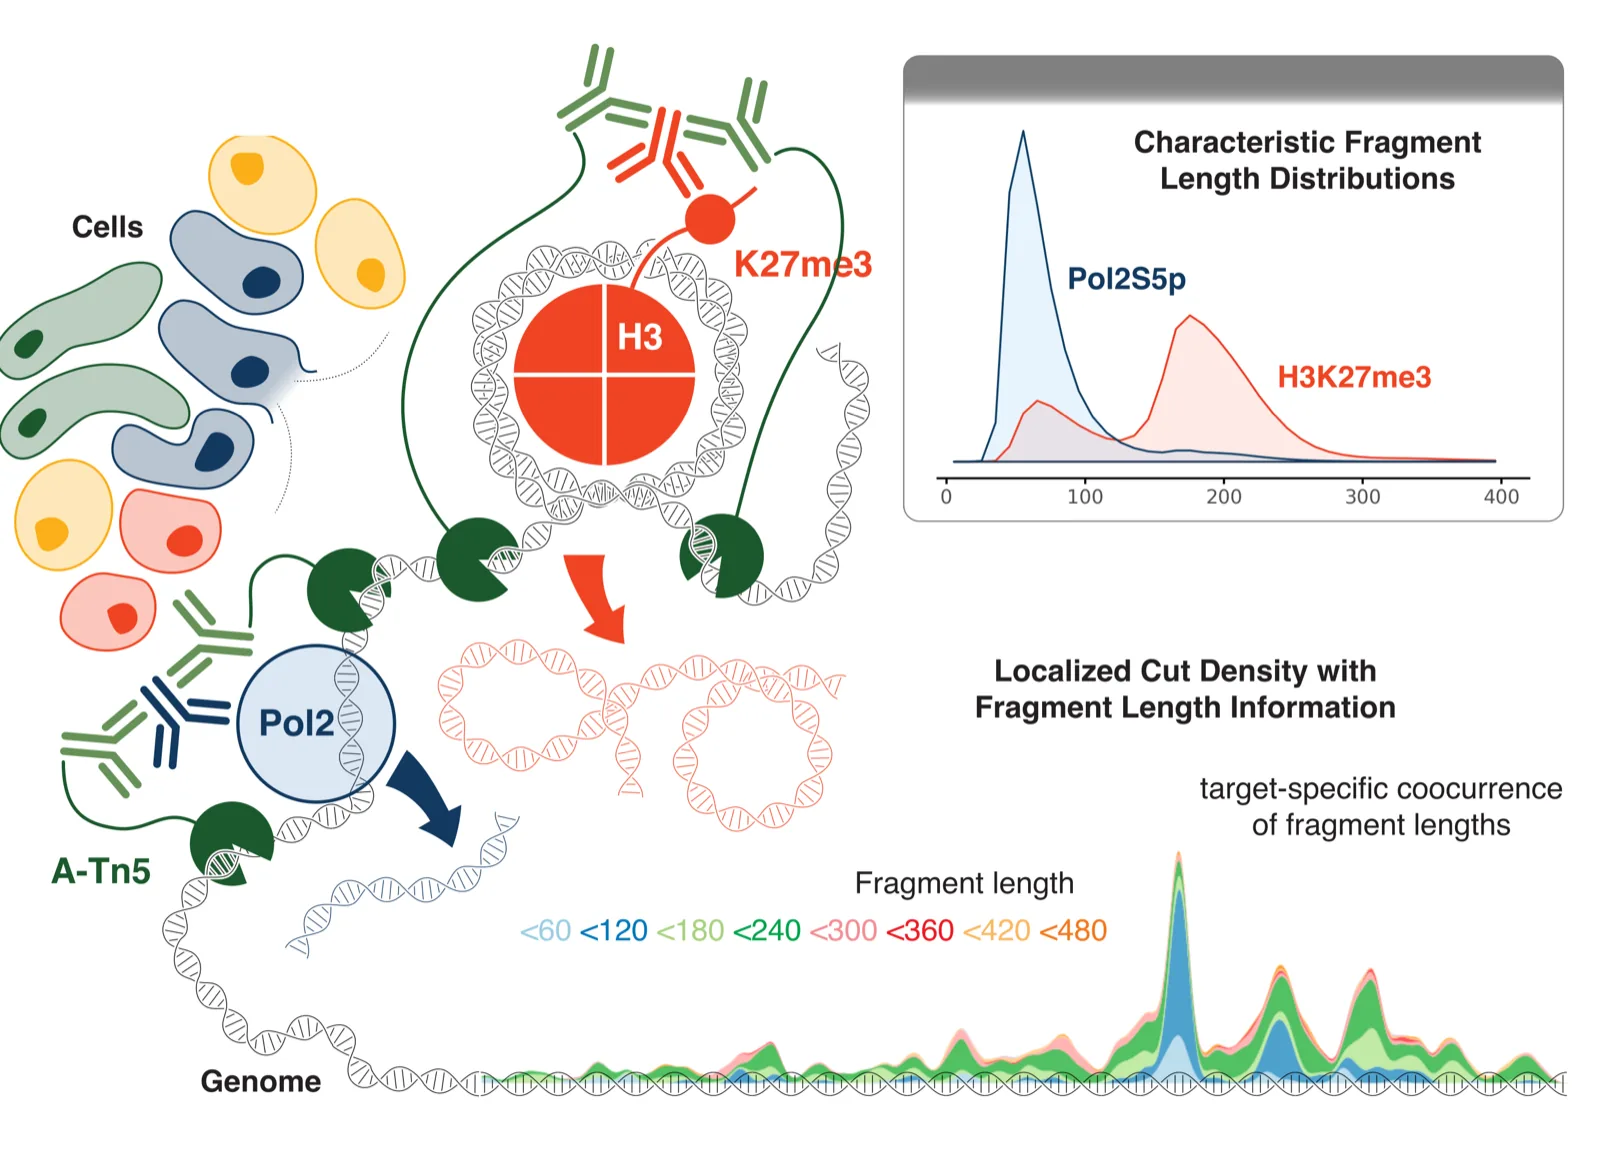
CUT&Tag2for1 cartoon: cells; chromatin with RNA polymerase II and an H3K27me3-marked nucleosome, each bound by its own antibody and cut by tethered Tn5; short fragments come from polymerase sites and long ones from H3K27me3; an inset shows the two marks' different fragment-length distributions; along the genome, cut density is coloured by fragment length.

CUT&Tag2for1 profiles an active and a silenced chromatin mark in the same cells in one experiment; 2for1separator separates the two signals. Janssens*, Otto* et al., Genome Biology 2022 (CC BY 4.0).
Genome tracks: the mixed CUT&Tag2for1 signal, single-antibody profiles of RNA polymerase II and H3K27me3, and the two tracks separated by 2for1separator, which match the single-antibody profiles.
Separated tracks match single-antibody controls. Janssens*, Otto* et al., Genome Biology 2022 (CC BY 4.0).

Genome Biology, 2022 (co-first author)

Prostate cancer genomics

My doctoral work at Universität Leipzig and the Fraunhofer Institute for Cell Therapy and Immunology produced ProstaTrend, a genomic risk score for aggressive prostate cancer validated in independent cohorts, and two patent filings on which I am co-inventor. My dissertation was on computational gene expression deconvolution.

European Urology, 2020 (co-first author)

How Kompot compares two conditions

Illustration with synthetic data, not a measurement.
  1. Sparse, noisy measurements

    In each condition, single-cell measurements of a gene are noisy, and in many cells the gene drops out entirely.

  2. A smooth function of cell state

    For each condition, Kompot learns expression as a smooth function of cell state, a Gaussian process that shares information between similar states.

  3. Its uncertainty

    Each function carries its posterior uncertainty, which widens where few cells inform it.

  4. The change at every cell state

    The difference between conditions is computed at every cell state, and a change stands out where it exceeds the uncertainty. No clusters are needed, so a change confined to part of a cell type stays visible. When Kompot adds up a gene's evidence across states, it accounts for the correlation between nearby estimates that comes from the smooth function, so similar states are not counted twice.

Machine learning that can be checked

Three principles carry through my work. First, every prediction comes with its uncertainty, so a supported result can be told apart from an extrapolation, and the uncertainty shows where the data are thin. Second, what my models learn on the way to a prediction, such as a density of cell states or a change in expression at every state, is a biological quantity that can be measured and tested directly. Third, AI agents help build and check the models, but they are not the scientific model; the models themselves use modern machine learning where it serves the question, and their parts stay measurable. Every decision and result the agents produce is documented with its evidence, so each step can be reproduced and audited.

For the third, I built agent_sandbox and Nexus, open tools that run sandboxed teams of AI agents on shared computing clusters, with independent re-checks of their results.

What is fixed across the program is the representation, the training objective and the requirement that every estimate carries its uncertainty. The learner is open: Gaussian processes, transformers, neural differential equations, flow-based models and discrete diffusion each fit where their strengths lie.